UX & Journey Mapping for BAs
BA Academy — self-paced module
By the end of this module, you will be able to:
- Explain what user experience (UX) design is and walk the stages of the UX design process
- Describe the major UX artifacts, especially the mapping family: journey maps, service blueprints, ecosystem maps, and empathy maps
- Scope a journey map correctly: business objective, audience, and the right altitude
- Draft a journey map and facilitate a journey-mapping workshop from welcome through opportunity-voting
- Finish a journey map that tells a story, and run a consequence scan on the proposed solution
- Explain how journey mapping complements the process mapping you learned in Module 5
Why a BA Should Care About UX
You have had this experience: a website starts blaring…
You have had this experience: a website starts blaring four auto-playing videos at once, and instead of hunting for pause buttons, you leave. Experiences like that leave lasting impressions and directly affect a product's success, which is why companies invest in user experience (UX) design: the practice of examining people's needs and motivations to inform the design of the overall experience with a product or service. Observing behavior, listening to feedback, and reviewing prototypes with real users guides design decisions toward experiences that are clear and enjoyable.
Why is this a BA elective? Three reasons. First,…
Why is this a BA elective? Three reasons. First, the overlap is enormous: UX design "sits at the intersection of business, technology, and people," which is a sentence you could paste into Module 1's definition of your own job. Second, Salesforce work is experience work: every layout, flow, and portal you write requirements for is someone's daily experience, and adoption (Modules 13 through 15) hinges on how that experience feels. Third, journey mapping specifically has become a standard BA facilitation skill, requested by name on many projects.
Reassurance for the artistically nervous: beauty takes a back…
Reassurance for the artistically nervous: beauty takes a back seat to clarity. Platform design systems (Salesforce's included) have already made the visual decisions: colors, typography, components. The UX skill you need is combining the pieces meaningfully around real user needs, and that is analysis, not art.
The UX Design Process
Every version of the UX process follows the same cyclical shape:
| Stage | Goal |
|---|---|
| Empathize | Learn about the audience you are designing for, through observation and interviews |
| Define | Create a point of view based on your users' needs and insights |
| Ideate | Brainstorm as many creative solutions as possible to the defined problem |
| Prototype & Test | Build a representation of your best ideas; test a rough draft with others; refine and test again |
And an ever-present fifth stage: Iterate. Designs almost always change based on what testing reveals, usually more than once. If this loop feels familiar, it should: empathize is Module 3's elicitation, define is requirements framing, ideate is Module 20's workshop craft, and prototype-and-test is Module 12's validation instinct applied earlier and cheaper. Business needs and available technology set the constraints; users inform everything inside them.
You will also hear named frameworks that package this loop (the Double Diamond, design sprints) and a catalog of UX principles with wonderful names (Fitts's Law: bigger, closer targets are easier to hit; Hick's Law: more choices mean slower decisions). Recognition-level knowledge is plenty: the loop is the substance.
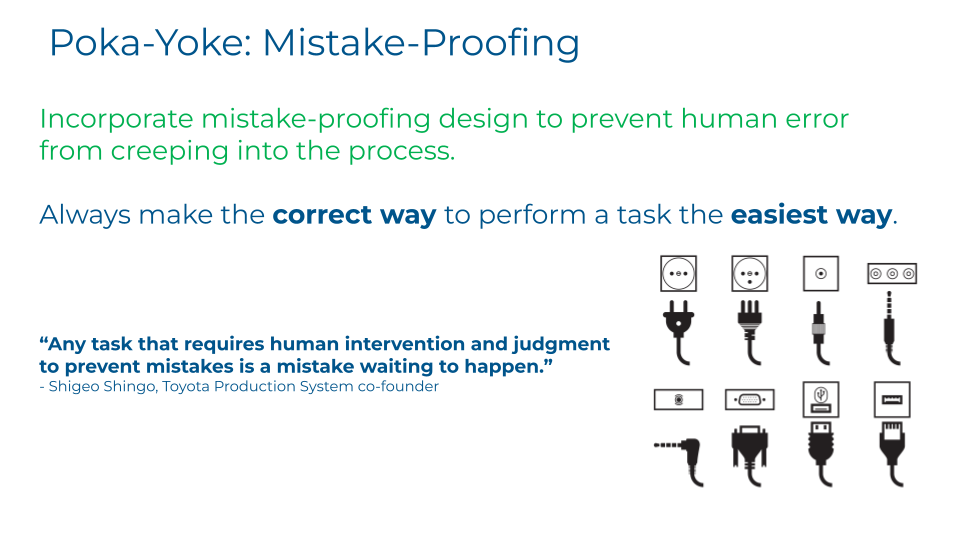
Poka-Yoke: Designing Against Mistakes
UX Artifacts
UX artifacts are the craft deliverables of the design process, and they fall into two main categories: mapping and screens.
The Mapping Family
Map-type artifacts are diagrammatic representations of a user's experience. They help designers and stakeholders empathize with the user, spot friction, and identify improvement opportunities: and like land maps, they range from world-map breadth to city-map zoom. The information comes from workshops and user conversations: the maps are research made visible.
- Journey map: a visualization of each step of a persona's experience with a product or service over time, across all touchpoints. The star of this module; full treatment below.
- Service blueprint: extends a journey map by diagramming what happens before and after the product interaction, and establishes the relationships between digital and physical interactions: the complete lifecycle view.
- Ecosystem map: visualizes complex relationships among multiple systems: invaluable (and sprawling) in enterprises with interdependent applications. When your integration conversations from Module 11 need a picture, this is it.
- Empathy map: a quick four-quadrant capture of what a user says, thinks, does, and feels: a lightweight companion to personas.
- Mental model and storyboard: respectively, how users believe a thing works, and a comic-strip narrative of an experience: both cheap, both clarifying.
Screens and Prototypes
The second category moves from understanding to designing: screen designs progressing through fidelity levels, from paper sketches to wireframes to interactive prototypes. Prototypes matter because testing a rough draft is radically cheaper than testing built software: they are acceptance criteria you can click. As a BA you will rarely produce high-fidelity screens, but you will constantly review them, test them with users, and translate the feedback into requirements (and your Module 1 toolkit already listed mockups and wireframes among BA contributions).
Tools, Lightly Held
The practical tool guidance: start with pencil and paper or a whiteboard (still the best brainstorming tools); lean on a design system rather than reinventing components; know that dedicated prototyping tools, virtual-workshop whiteboards, and all-in-one design platforms exist and evolve fast, so stay flexible rather than marrying one tool. Workshops themselves are tools: hold them early for discovery and mid-project for prioritization, and recruit diverse participants so outcomes are inclusive across ages, backgrounds, abilities, and cultures.
One UX habit worth stealing immediately: the feedback discipline. Ask for feedback on everything, make it easy to give (share in formats stakeholders can mark up), and when giving feedback yourself, make it actionable: "the button is hard to find" helps; "I don't like it" does not. This is Module 1's feedback-seeking habit, professionalized.
Journey Maps: The Customer's Story, Drawn
What a Journey Map Is
A journey map is a document that visually illustrates the experience a customer (or user) has with an organization. It identifies:
- The steps or activities the person takes to accomplish a goal
- The challenges they face along the way
- The people they interact with, in one organization or across an ecosystem
- The touchpoints and channels (devices, apps, calls, visits) they encounter
- The feelings, thoughts, and reactions they have throughout
Every journey has highs and lows, and their combination makes or breaks the experience. The crucial discipline: the map captures everything from the customer's point of view, not the organization's.
A simple example: a customer of a subscription service has a support request. Enrollment; a phone call with a question; the representative opens a request and sends confirmation; the rep checks service history (perhaps consulting sales colleagues about prior conversations, or operations for an approval); the service is provided; the record updates and appears in the customer's online portal. The map captures all of it, including the invisible-to-the-customer collaboration, because anything that affects the customer's experience belongs on the map.
Journey Maps vs. Process Maps
Here is the connection to Module 5 that makes this module click for BAs. A process map shows how the organization executes work: swim lanes, handoffs, systems. A journey map shows how the customer experiences that work: waiting, wondering, calling back, feeling relieved. Same underlying reality, opposite camera angle. The most powerful analysis pairs them: the process map explains why the journey map's painful waiting step exists, and the journey map explains why anyone should care about fixing the process. Speak both languages and you can translate customer pain directly into process requirements.
Why Journey Mapping Pays
The benefits: it builds shared understanding of everything the customer experiences; it demystifies how each role affects the customer (people who think their work is invisible discover it is a touchpoint); it aligns teams across silos around one story; it surfaces process optimizations and pain points with their emotional stakes attached; it grounds prioritization in customer impact; and it produces an artifact that keeps influencing decisions long after the workshop ends.
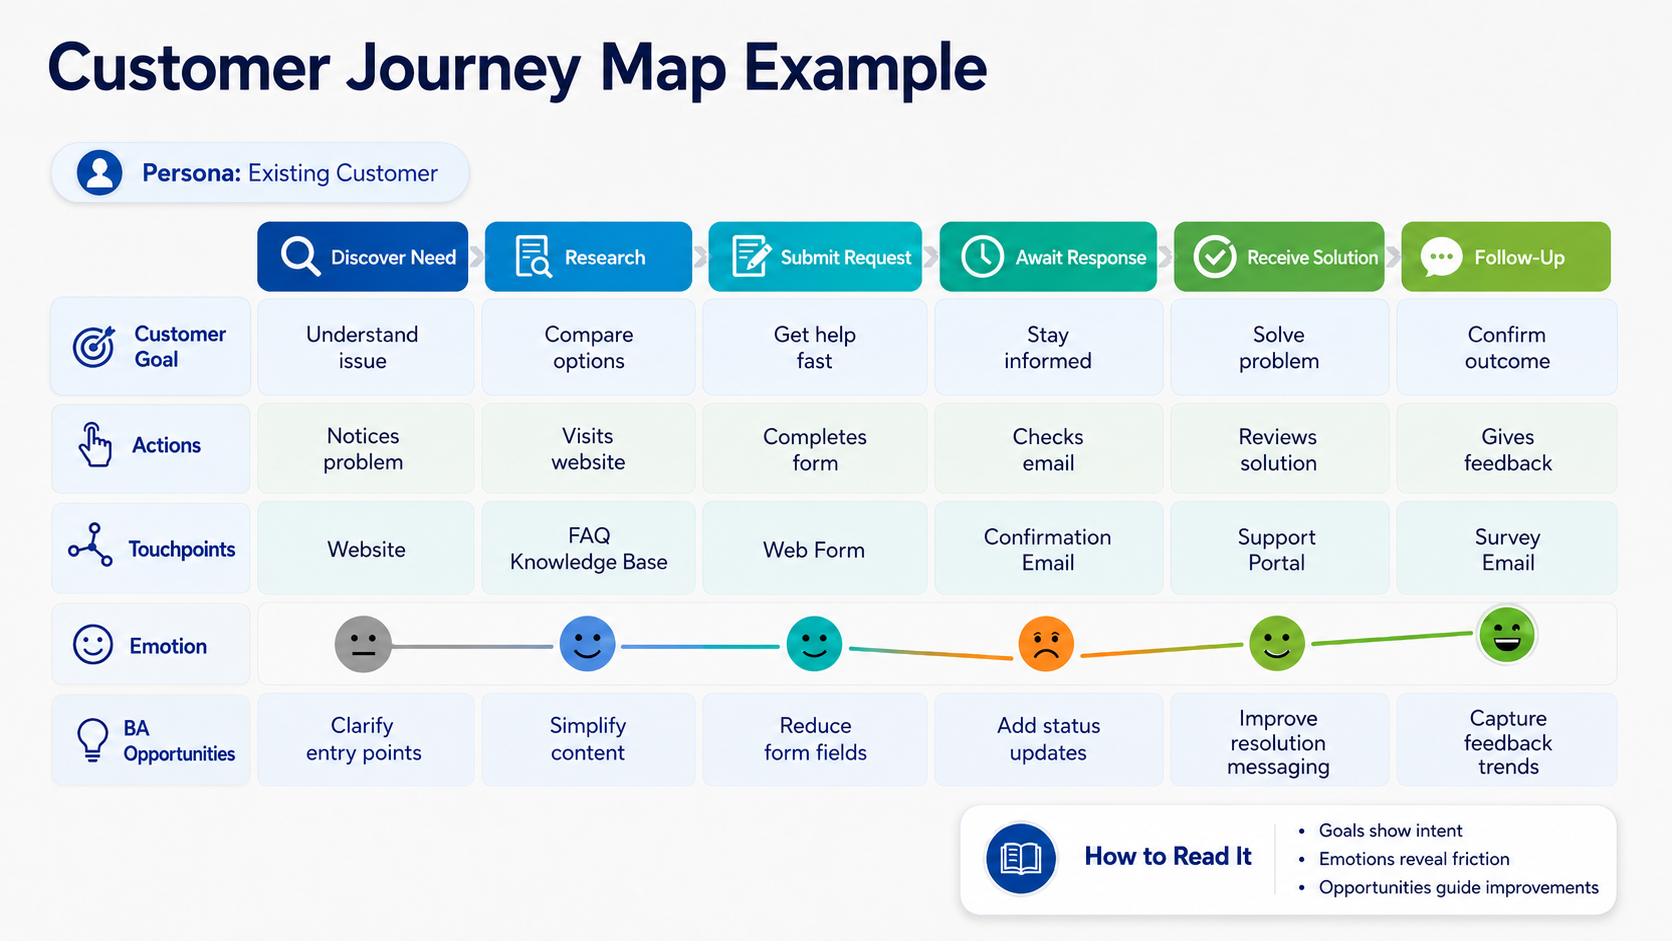
Journey Map
Scoping a Journey Map
Before mapping anything, fix two assumptions: why you are doing it (the business objective) and who you are focusing on (the audience). These keep the work focused and the recommendations relevant.
Business objectives that commonly drive journey mapping: create a differentiated customer experience; acquire new customers; increase frequency of product use; integrate a new feature into an existing experience; increase efficiency or effectiveness; improve completion rates of a specific task; improve service quality and reduce support calls.
Scope needs the Goldilocks touch. Too broad, and insights are too general to apply (and you cannot get performance data to track success). Too narrow, and you fixate on one element, miss the context, and overspend the team's time on a sliver. Worked examples, phrased from the customer's point of view (itself an empathy exercise):
| Customer-voiced objective | Right scope? |
|---|---|
| "I want to have all my needs met." | Too broad: aim for actionable, measurable insight |
| "I want to view open cases." | Too narrow: broaden to "I want to manage my customer requests" |
| "I want to purchase a technology solution that helps us automate service processes." | Right: a tactical goal with a clear start and end that will reveal the whole journey |
If your organization uses Jobs to Be Done (Module 3), the alignment is direct: a journey map for satisfying a key job statement is a natural pairing, and "job altitude" is the same scoping instinct by another name.
Audience requires choosing one perspective per map. Candidates: the customer (most common); employees and partners (their journeys determine whether they can deliver the customer's: internal journey maps are underrated); and in business-to-business contexts, your customer's customer, whose experience your customer is trying to serve. Different audiences mean different maps: resist the mega-map that tries to be everyone's story.
The Architecture of a Journey Map
The standard grid, row by row:
- Phases: the distinct stages of the experience (for example: awareness, consideration, purchase, onboarding, advocacy)
- Actions: what the person does in each phase
- Thoughts: what they are thinking (changes here often signal a new phase beginning)
- Feelings: how they feel (ditto: emotional shifts mark phase boundaries)
- Touchpoints: where your brand, product, or service comes into play, in either direction
- Context: the environmental, social, and time factors shaping their ability to reach the goal
- Opportunities: where and how you can have the most impact: reducing pain or reinforcing strengths
Drafting the First Version
Get everything out of your head before organizing it: using your customer research, map the steps on sticky notes (physical or virtual), one activity or decision per note. Expect either too many notes or a too-high-level first pass; both are fine: this stage is about volume, not polish. Then group activities into phases based on mindset or context changes (or start from known phases and decompose: either direction works). Color-code for hierarchy at a glance: one color for phases, another for actions.
Then stop. Before building the whole map yourself, bring in the others.
The Journey-Mapping Workshop
Who to Invite
Enlist cocreators: many teams touch the customer, and the final journey must resonate widely to matter. Aim for five to seven people, chosen behaviorally rather than by title:
- People who know your customer: sales, researchers, support
- People who are generative: idea machines who build on others' thinking
- People who can build: they will ground opportunities in feasibility
- People with influence: the map needs ambassadors afterward
(Your Module 16 stakeholder matrix is the recruiting list; your Module 20 facilitation craft is about to get a workout.)
Running the Session
Open well. Set an inviting, collaborative tone: warm welcome, introductions, agenda and expectations, materials distributed and reviewed.
Validate the skeleton first. Have participants review your drafted phases and actions: Do they ring true to life? Did we miss anything? Include anything unnecessary? Get the skeleton right before hanging anything on it.
Gather insights together. Participants mine the research materials for customer quotes, feedback, and insights: one insight per sticky note. Prompt them to look beyond product mechanics to relationship factors: social dynamics, values, trust, emotional readiness to deepen engagement, community impact. Where nobody knows what the customer experiences at some step, form a hypothesis and flag it for follow-up research: an honest gap beats a confident guess.
Synthesize. This is how insights become the journey: more art than science, in two steps. Cluster: group insights by related themes (empathy matters most here: what is actually most important to the customer in each phase?), reclustering freely until themes feel resolved. Express: craft phrases capturing each important cluster's thoughts, feelings, touchpoints, and context: aim for the top three or four points per cell of the journey grid. When solution ideas erupt mid-synthesis (they will), park them in a parking lot to honor without derailing (Module 13's tool, working overtime).
Step back. Review the complete story the synthesized map tells. Where are the emotional lows? Where does the experience contradict the organization's promises? What surprised the room?
Find the opportunities. Turn to the parking lot and the pain points, generate opportunity statements, and prioritize democratically: dot voting (everyone gets a few dots to place on their top choices) surfaces the group's collective priorities fast and fairly. The winners feed your backlog: opportunities become epics and stories through exactly the Module 4 machinery.
Finishing the Map: Story, Visuals, and Conscience
Tell a Story
A journey map is ultimately a story. Walk your draft end to end as narrative, and answer three questions: What is your one-sentence introduction? What is your summary? What is your point of view on the best first steps to take as a result? A map that cannot be narrated is a spreadsheet in disguise.
Make It Readable
Do not skip visual polish, and do not confuse it with aesthetics: this is about readability and effectiveness. Ask: What must people take away? What if they encounter the map without you there to explain it? What if they only have a few minutes? Concrete touches that transform comprehension: a persona header with photo and story ("Meet Jack, 32, who prefers email, values convenience, and browses from his phone") grounds every reader in a human being; emoji or curve visualizations of the Feelings row make the highs and lows legible at a glance. With story elements added, the map stops being a business graph and becomes the foundation for your solution.
Run a Consequence Scan
One final pass before celebrating: a consequence scan: pausing to consider unintended consequences of your proposed solution and how to mitigate them. Reconvene your workshop participants, share the refined map and opportunities, and ask:
- What could this idea mean to the customer: security, reliability, support, accessibility?
- What could it mean for wellbeing and relationships: who else does the customer's experience affect?
- What if everyone in the world used it: any broad community or societal impact?
- Could it shift or deepen power structures or privilege?
Be genuinely prepared to revise or replace ideas based on the answers. Responsible innovation builds the customer and community relationships that business success rests on: and for a course training analysts to serve real communities, this scan is not a nice-to-have; it is the job done honorably.
Key Takeaways
- UX design examines people's needs and motivations to shape experiences, through an empathize-define-ideate-prototype/test loop plus relentless iteration: clarity over beauty, users inside business and technology constraints.
- Know the artifact families: mapping (journey maps, service blueprints, ecosystem maps, empathy maps) for understanding; screens and prototypes for designing cheaply before building expensively.
- Journey maps tell the customer's story: steps, challenges, people, touchpoints, and feelings, from their point of view. Process maps show the organization's view; pairing the two translates customer pain into process requirements.
- Scope before mapping: a business objective, an audience (customer, employee/partner, or your customer's customer), and Goldilocks altitude: a tactical goal with a clear start and end.
- The grid: phases, actions, thoughts, feelings, touchpoints, context, opportunities. Draft with sticky notes, group into phases, then cocreate: five to seven behaviorally chosen participants, skeleton validated first, insights clustered and expressed, ideas parked, opportunities dot-voted.
- Finish like a storyteller (introduction, summary, recommended first steps), design for the reader who has three minutes and no narrator, and run a consequence scan before shipping the recommendations.
Knowledge Check
8 questions. Answer at your own pace, then check the explanation for each.
Module 19 complete
Nice work. Review any question again using the menu (top right), or move on.
Continue to Module 20: Facilitation & Innovation Workshops →